Category: mathematics
A small computational thought experiment
In Macklin (2017), I briefly touched on a simple computational thought experiment that shows that for a group of homogeneous cells, you can observe substantial heterogeneity in cell behavior. This “thought experiment” is part of a broader preview and discussion of a fantastic paper by Linus Schumacher, Ruth Baker, and Philip Maini published in Cell Systems, where they showed that a migrating collective homogeneous cells can show heterogeneous behavior when quantitated with new migration metrics. I highly encourage you to check out their work!
In this blog post, we work through my simple thought experiment in a little more detail.
Note: If you want to reference this blog post, please cite the Cell Systems preview article:
P. Macklin, When seeing isn’t believing: How math can guide our interpretation of measurements and experiments. Cell Sys., 2017 (in press). DOI: 10.1016/j.cells.2017.08.005
The thought experiment
Consider a simple (and widespread) model of a population of cycling cells: each virtual cell (with index i) has a single “oncogene” \( r_i \) that sets the rate of progression through the cycle. Between now (t) and a small time from now ( \(t+\Delta t\)), the virtual cell has a probability \(r_i \Delta t\) of dividing into two daughter cells. At the population scale, the overall population growth model that emerges from this simple single-cell model is:
\[\frac{dN}{dt} = \langle r\rangle N, \]
where \( \langle r \rangle \) the mean division rate over the cell population, and N is the number of cells. See the discussion in the supplementary information for Macklin et al. (2012).
Now, suppose (as our thought experiment) that we could track individual cells in the population and track how long it takes them to divide. (We’ll call this the division time.) What would the distribution of cell division times look like, and how would it vary with the distribution of the single-cell rates \(r_i\)?
Mathematical method
In the Matlab script below, we implement this cell cycle model as just about every discrete model does. Here’s the pseudocode:
t = 0;
while( t < t_max )
    for i=1:Cells.size()
        u = random_number();
        if( u < Cells[i].birth_rate * dt )
            Cells[i].division_time = Cells[i].age;
            Cells[i].divide();
        end
    end
    t = t+dt;
end
That is, until we’ve reached the final simulation time, loop through all the cells and decide if they should divide: For each cell, choose a random number between 0 and 1, and if it’s smaller than the cell’s division probability (\(r_i \Delta t\)), then divide the cell and write down the division time.
As an important note, we have to track the same cells until they all divide, rather than merely record which cells have divided up to the end of the simulation. Otherwise, we end up with an observational bias that throws off our recording. See more below.
The sample code
You can download the Matlab code for this example at:
http://MathCancer.org/files/matlab/thought_experiment_matlab(Macklin_Cell_Systems_2017).zip
Extract all the files, and run “thought_experiment” in Matlab (or Octave, if you don’t have a Matlab license or prefer an open source platform) for the main result.
All these Matlab files are available as open source, under the GPL license (version 3 or later).
Results and discussion
First, let’s see what happens if all the cells are identical, with \(r = 0.05 \textrm{ hr}^{-1}\). We run the script, and track the time for each of 10,000 cells to divide. As expected by theory (Macklin et al., 2012) (but perhaps still a surprise if you haven’t looked), we get an exponential distribution of division times, with mean time \(1/\langle r \rangle\):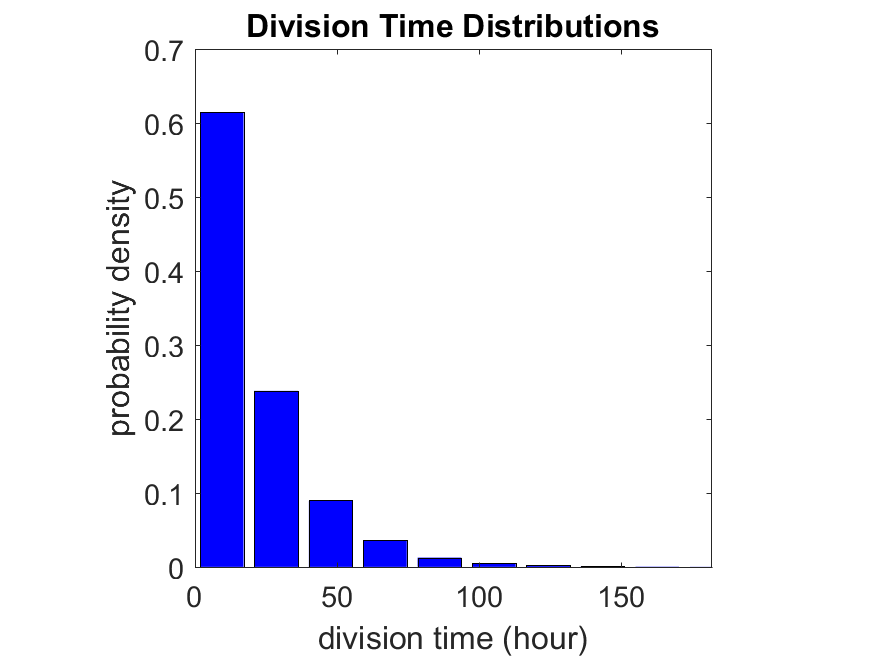
So even in this simple model, a homogeneous population of cells can show heterogeneity in their behavior. Here’s the interesting thing: let’s now give each cell its own division parameter \(r_i\) from a normal distribution with mean \(0.05 \textrm{ hr}^{-1}\) and a relative standard deviation of 25%: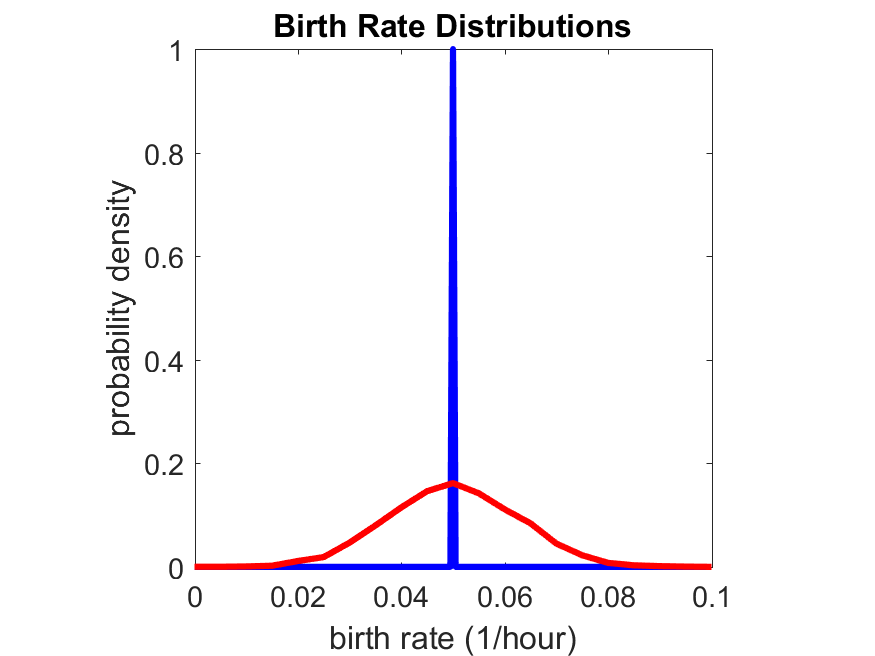
If we repeat the experiment, we get the same distribution of cell division times!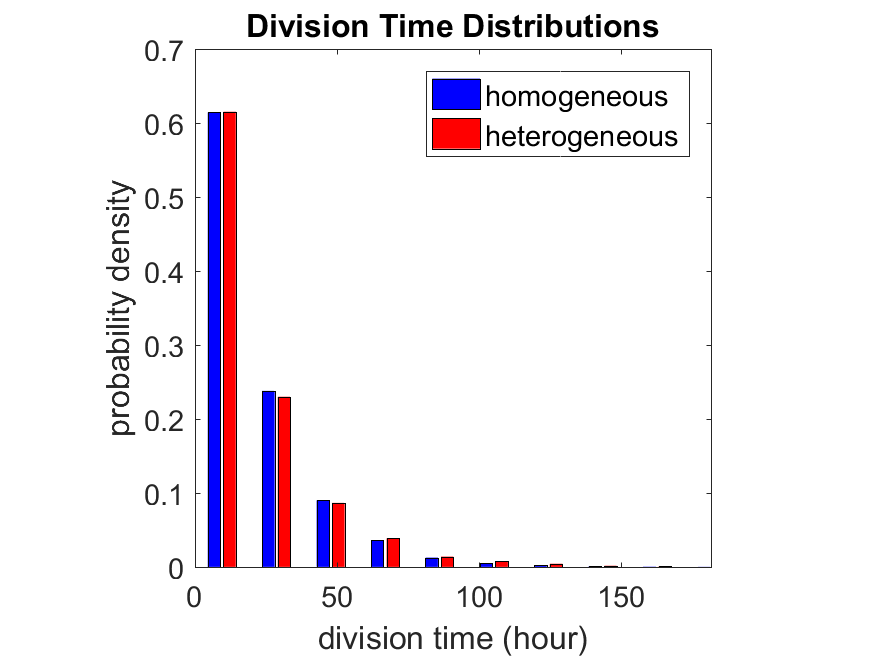
So in this case, based solely on observations of the phenotypic heterogeneity (the division times), it is impossible to distinguish a “genetically” homogeneous cell population (one with identical parameters) from a truly heterogeneous population. We would require other metrics, like tracking changes in the mean division time as cells with a higher \(r_i\) out-compete the cells with lower \(r_i\).
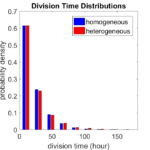
Lastly, I want to point out that caution is required when designing these metrics and single-cell tracking. If instead we had tracked all cells throughout the simulated experiment, including new daughter cells, and then recorded the first 10,000 cell division events, we would get a very different distribution of cell division times: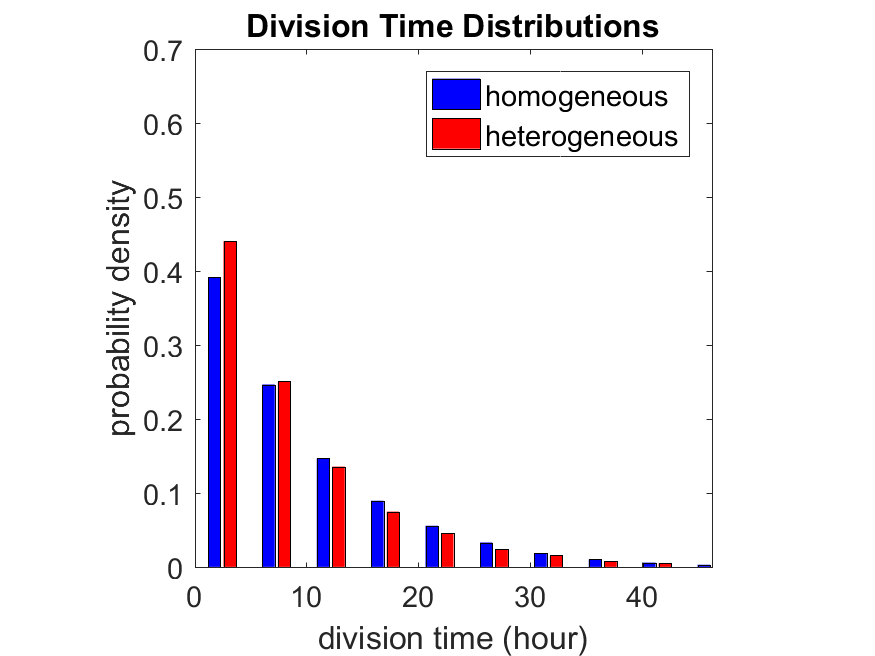
By only recording the division times for the cells that have divided, and not those that haven’t, we bias our observations towards cells with shorter division times. Indeed, the mean division time for this simulated experiment is far lower than we would expect by theory. You can try this one by running “bad_thought_experiment”.
Further reading
This post is an expansion of our recent preview in Cell Systems in Macklin (2017):
P. Macklin, When seeing isn’t believing: How math can guide our interpretation of measurements and experiments. Cell Sys., 2017 (in press). DOI: 10.1016/j.cells.2017.08.005
And the original work on apparent heterogeneity in collective cell migration is by Schumacher et al. (2017):
L. Schumacher et al., Semblance of Heterogeneity in Collective Cell Migration. Cell Sys., 2017 (in press). DOI: 10.1016/j.cels.2017.06.006
You can read some more on relating exponential distributions and Poisson processes to common discrete mathematical models of cell populations in Macklin et al. (2012):
P. Macklin, et al., Patient-calibrated agent-based modelling of ductal carcinoma in situ (DCIS): From microscopic measurements to macroscopic predictions of clinical progression. J. Theor. Biol. 301:122-40, 2012. DOI: 10.1016/j.jtbi.2012.02.002.
Lastly, I’d be delighted if you took a look at the open source software we have been developing for 3-D simulations of multicellular systems biology:
http://OpenSource.MathCancer.org
And you can always keep up-to-date by following us on Twitter: @MathCancer.
Paul Macklin interviewed at 2013 PSOC Annual Meeting
Paul Macklin gave a plenary talk at the 2013 NIH Physical Sciences in Oncology Annual Meeting. After the talk, he gave an interview to the Pauline Davies at the NIH on the need for data standards and model compatibility in computational and mathematical modeling of cancer. Of particular interest:
Pauline Davies: How would you ever get this standardization? Who would be responsible for saying we want it all reported in this particular way?
Paul Macklin: That’s a good question. It’s a bit of the chicken and the egg problem. Who’s going to come and give you data in your standard if you don’t have a standard? How do you plan a standard without any data? And so it’s a bit interesting. I just think someone needs to step forward and show leadership and try to get a small working group together, and at the end of the day, perfect is the enemy of the good. I think you start small and give it a go, and you add more to your standard as you need it. So maybe version one is, let’s say, how quickly the cells divide, how often they do it, how quickly they die, and what their oxygen level is, and maybe their positions. And that can be version one of this standard and a few of us try it out and see what we can do. I think it really comes down to a starting group of people and a simple starting point, and you grow it as you need it.
Shortly after, the MultiCellDS project was born (using just this strategy above!), with the generous assistance of the Breast Cancer Research Foundation.
Read / Listen to the interview: http://physics.cancer.gov/report/2013report/PaulMacklin.aspx (2013)
DCIS modeling paper accepted
I am pleased to report that our paper has now been accepted. You can download the accepted preprint here. We also have a lot of supplementary material, including simulation movies, simulation datasets (for 0, 15, 30, adn 45 days of growth), and open source C++ code for postprocessing and visualization.
I discussed the results in detail here, but here’s the short version:
- We use a mechanistic, agent-based model of individual cancer cells growing in a duct. Cells are moved by adhesive and repulsive forces exchanged with other cells and the basement membrane. Cell phenotype is controlled by stochastic processes.
- We constrained all parameter expected to be relatively independent of patients by a careful analysis of the experimental biological and clinical literature.
- We developed the very first patient-specific calibration method, using clinically-accessible pathology. This is a key point in future patient-tailored predictions and surgical/therapeutic planning.
- The model made numerous quantitative predictions, such as:
- The tumor grows at a constant rate, between 7 to 10 mm/year. This is right in the middle of the range reported in the clinic.
- The tumor’s size in mammgraphy is linearly correlated with the post-surgical pathology size. When we linearly extrapolate our correlation across two orders of magnitude, it goes right through the middle of a cluster of 87 clinical data points.
- The tumor necrotic core has an age structuring: with oldest, calcified material in the center, and newest, most intact necrotic cells at the outer edge.
- The appearance of a “typical” DCIS duct cross-section varies with distance from the leading edge; all types of cross-sections predicted by our model are observed in patient pathology.
- The model also gave new insight on the underlying biology of breast cancer, such as:
- The split between the viable rim and necrotic core (observed almost universally in pathology) is not just an artifact, but an actual biomechanical effect from fast necrotic cell lysis.
- The constant rate of tumor growth arises from the biomechanical stress relief provided by lysing necrotic cells. This points to the critical role of intracellular and intra-tumoral water transport in determining the qualitative and quantitative behavior of tumors.
- Pyknosis (nuclear degradation in necrotic cells), must occur at a time scale between that of cell lysis (on the order of hours) and cell calcification (on the order of weeks).
- The current model cannot explain the full spectrum of calcification types; other biophysics, such as degradation over a long, 1-2 month time scale, must be at play.
Now hiring: Postdoctoral Researcher
I just posted a job opportunity for a postdoctoral researcher for computational modeling of breast, prostate, and metastatic cancer, with a heavy emphasis on calibrating (and validating!) to in vitro, in vivo, and clinical data.
If you’re a talented computational modeler and have a passion for applying mathematics to make a difference in clinical care, please read the job posting and apply!
(Note: Interested students in the Los Angeles/Orange County area may want to attend my applied math seminar talk at UCI next week to learn more about this work.)
PSOC Short Course on Multidisciplinary Cancer Modeling
Next Monday (October 17, 2011), the USC-led Physical Sciences Oncology Center / CAMM will host a short course on multidisciplinary cancer modeling, combining the expertise of biologists, oncologists, and physical scientists. I’ll attach a PDF flyer of the schedule below. I am giving a talk during “Session II – The Physicist Perspective on Cancer.” I will focus on tailoring mathematical models from the ground up to clinical data from individual patients, with an emphasis on using computational models to make testable clinical predictions, and using these models a platforms to generate hypotheses on cancer biology.
The response to our short course has been overwhelming (in a good way), with around 200 registrants! So, registration is unfortunately closed at this time. However, the talks will be broadcast live via a webcast. The link and login details are in the PDF below. I hope to see you there! — Paul
Agenda
7:00 am – 8:25 am : Registration, breakfast, and opening comments, etc.
David B. Agus, M.D. (Director of USC CAMM)
W. Daniel Hillis, Ph.D. (PI of USC PSOC, Applied Minds)
Larry A. Nagahara (NCI PSOC Program Director)
8:30 am – 10:15 am : Session I – Cancer Biology and the Cancer Genome
Paul Mischel, UCLA – The Biology of Cancer from Cell to Patient, Oncogenesis to Therapeutic Response
Matteo Pellegrini, UCLA – Evolution in Cancer
Mitchelll Gross, USC – Historical Perspective on Cancer Diagnosis and Treatment
10:30 am – 12:15 pm : Session II – The Physicist Perspective on Cancer
Dan Ruderman, USC – Cancer as a Multi-scale Problem
Paul Macklin, USC – Computational Models of Cancer Growth
Tom Tombrello, Cal-Tech – Perspective: Big Problems in Physics vs. Cancer
1:45 pm. – 3:10 pm : Session III – Novel Measurement Platforms & Data Management & Integration
Michelle Povinelli, USC – The Role of Novel Microdevices in Dissecting Cellular Phenomena
Carl Kesselman, USC – Data Management & Integration Challenges in Interdisciplinary Studies
3:10 pm – 3:40 pm : Session IV – Creativity in Research at the Interface between the Life and Physical Sciences
‘Fireside Chat’ David Agus and Danny Hillis, USC
4:00 pm – 5:00 pm : Capstone – Keynote Speaker
Tim Walsh, Game Inventor, Keynote Speaker
5:30 pm – 8:00 pm : Poster Session and Reception