Category: in the news
A small computational thought experiment
In Macklin (2017), I briefly touched on a simple computational thought experiment that shows that for a group of homogeneous cells, you can observe substantial heterogeneity in cell behavior. This “thought experiment” is part of a broader preview and discussion of a fantastic paper by Linus Schumacher, Ruth Baker, and Philip Maini published in Cell Systems, where they showed that a migrating collective homogeneous cells can show heterogeneous behavior when quantitated with new migration metrics. I highly encourage you to check out their work!
In this blog post, we work through my simple thought experiment in a little more detail.
Note: If you want to reference this blog post, please cite the Cell Systems preview article:
P. Macklin, When seeing isn’t believing: How math can guide our interpretation of measurements and experiments. Cell Sys., 2017 (in press). DOI: 10.1016/j.cells.2017.08.005
The thought experiment
Consider a simple (and widespread) model of a population of cycling cells: each virtual cell (with index i) has a single “oncogene” \( r_i \) that sets the rate of progression through the cycle. Between now (t) and a small time from now ( \(t+\Delta t\)), the virtual cell has a probability \(r_i \Delta t\) of dividing into two daughter cells. At the population scale, the overall population growth model that emerges from this simple single-cell model is:
\[\frac{dN}{dt} = \langle r\rangle N, \]
where \( \langle r \rangle \) the mean division rate over the cell population, and N is the number of cells. See the discussion in the supplementary information for Macklin et al. (2012).
Now, suppose (as our thought experiment) that we could track individual cells in the population and track how long it takes them to divide. (We’ll call this the division time.) What would the distribution of cell division times look like, and how would it vary with the distribution of the single-cell rates \(r_i\)?
Mathematical method
In the Matlab script below, we implement this cell cycle model as just about every discrete model does. Here’s the pseudocode:
t = 0;
while( t < t_max )
    for i=1:Cells.size()
        u = random_number();
        if( u < Cells[i].birth_rate * dt )
            Cells[i].division_time = Cells[i].age;
            Cells[i].divide();
        end
    end
    t = t+dt;
end
That is, until we’ve reached the final simulation time, loop through all the cells and decide if they should divide: For each cell, choose a random number between 0 and 1, and if it’s smaller than the cell’s division probability (\(r_i \Delta t\)), then divide the cell and write down the division time.
As an important note, we have to track the same cells until they all divide, rather than merely record which cells have divided up to the end of the simulation. Otherwise, we end up with an observational bias that throws off our recording. See more below.
The sample code
You can download the Matlab code for this example at:
http://MathCancer.org/files/matlab/thought_experiment_matlab(Macklin_Cell_Systems_2017).zip
Extract all the files, and run “thought_experiment” in Matlab (or Octave, if you don’t have a Matlab license or prefer an open source platform) for the main result.
All these Matlab files are available as open source, under the GPL license (version 3 or later).
Results and discussion
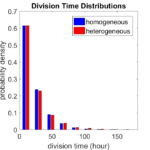
First, let’s see what happens if all the cells are identical, with \(r = 0.05 \textrm{ hr}^{-1}\). We run the script, and track the time for each of 10,000 cells to divide. As expected by theory (Macklin et al., 2012) (but perhaps still a surprise if you haven’t looked), we get an exponential distribution of division times, with mean time \(1/\langle r \rangle\):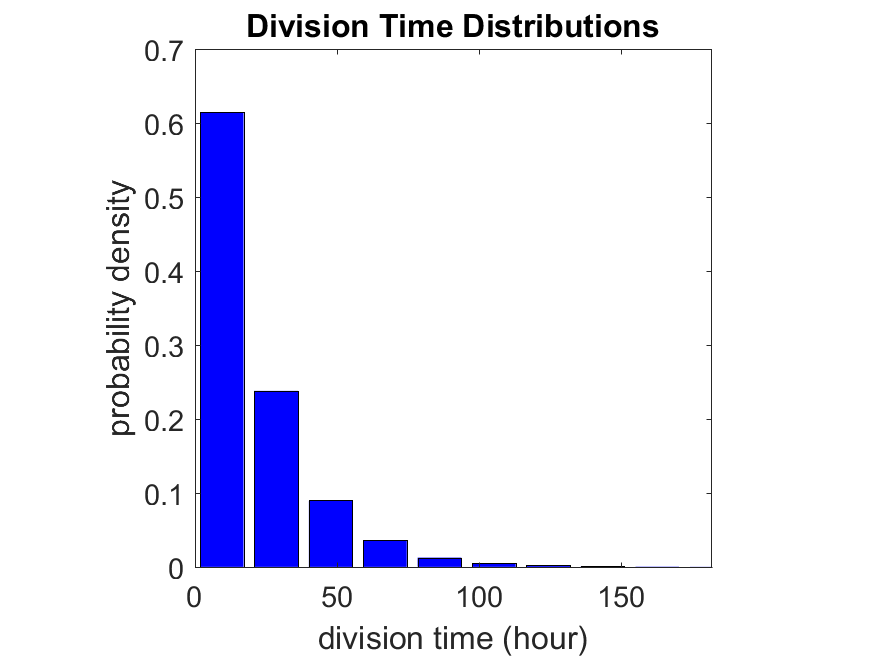
So even in this simple model, a homogeneous population of cells can show heterogeneity in their behavior. Here’s the interesting thing: let’s now give each cell its own division parameter \(r_i\) from a normal distribution with mean \(0.05 \textrm{ hr}^{-1}\) and a relative standard deviation of 25%: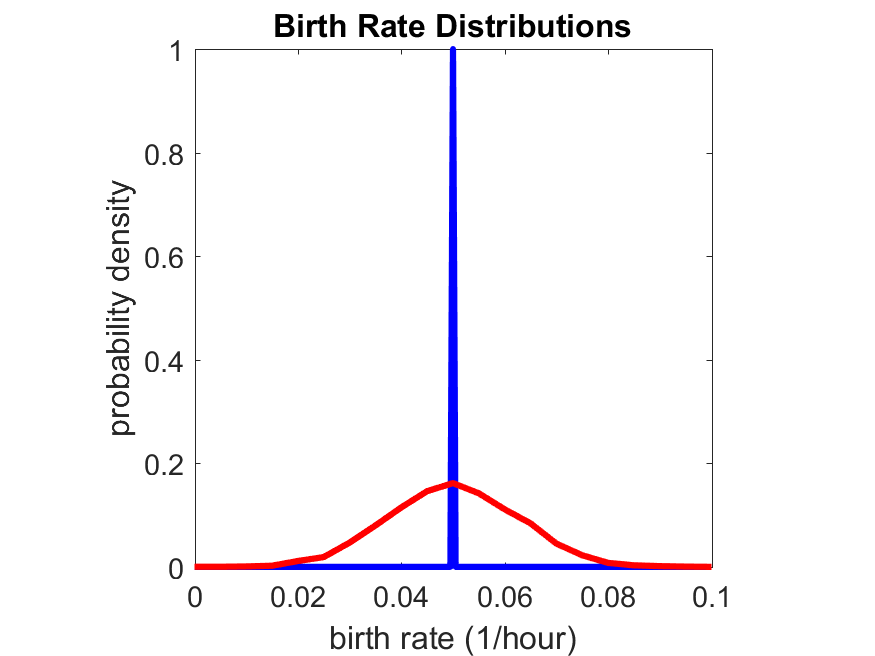
If we repeat the experiment, we get the same distribution of cell division times!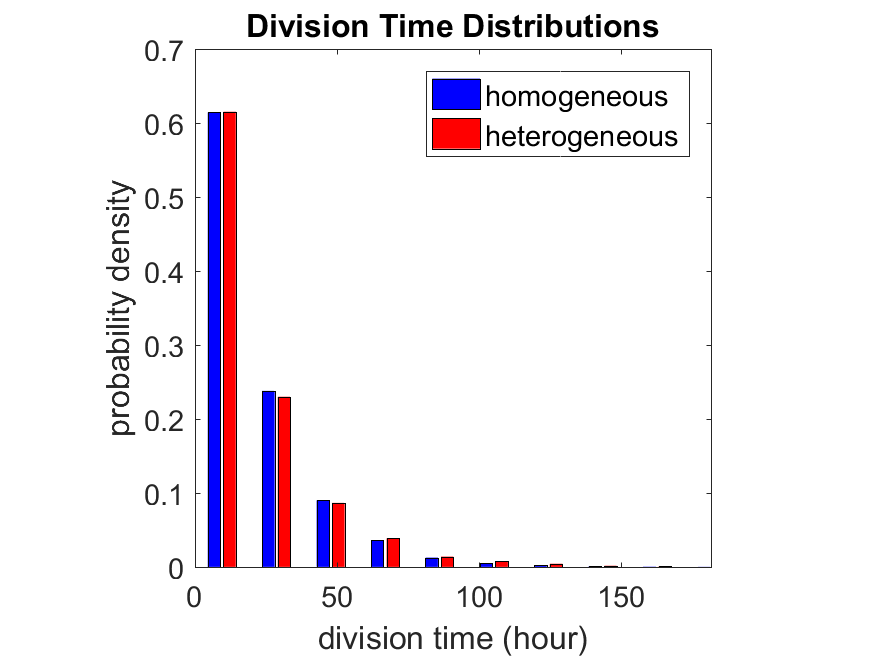
So in this case, based solely on observations of the phenotypic heterogeneity (the division times), it is impossible to distinguish a “genetically” homogeneous cell population (one with identical parameters) from a truly heterogeneous population. We would require other metrics, like tracking changes in the mean division time as cells with a higher \(r_i\) out-compete the cells with lower \(r_i\).
Lastly, I want to point out that caution is required when designing these metrics and single-cell tracking. If instead we had tracked all cells throughout the simulated experiment, including new daughter cells, and then recorded the first 10,000 cell division events, we would get a very different distribution of cell division times: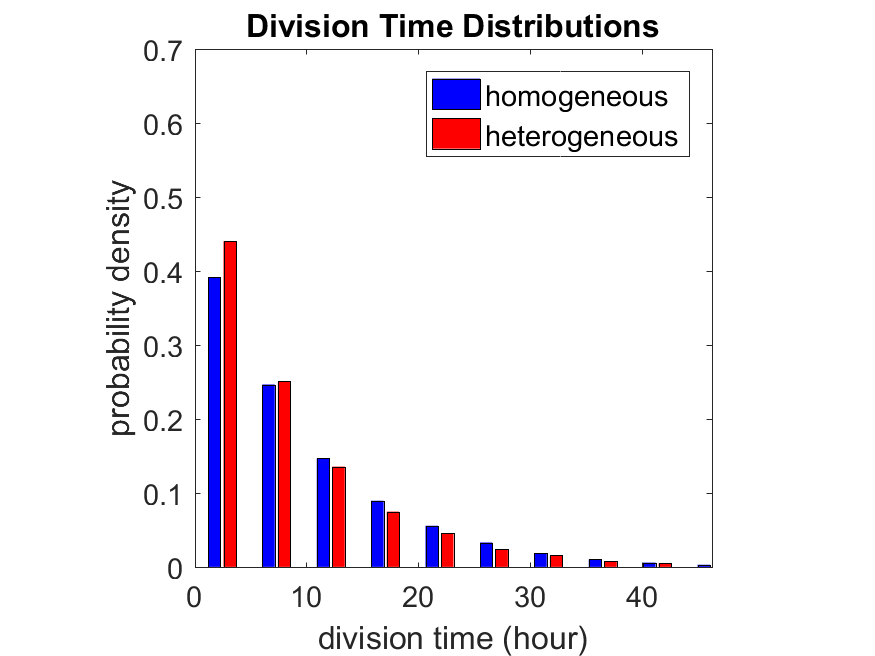
By only recording the division times for the cells that have divided, and not those that haven’t, we bias our observations towards cells with shorter division times. Indeed, the mean division time for this simulated experiment is far lower than we would expect by theory. You can try this one by running “bad_thought_experiment”.
Further reading
This post is an expansion of our recent preview in Cell Systems in Macklin (2017):
P. Macklin, When seeing isn’t believing: How math can guide our interpretation of measurements and experiments. Cell Sys., 2017 (in press). DOI: 10.1016/j.cells.2017.08.005
And the original work on apparent heterogeneity in collective cell migration is by Schumacher et al. (2017):
L. Schumacher et al., Semblance of Heterogeneity in Collective Cell Migration. Cell Sys., 2017 (in press). DOI: 10.1016/j.cels.2017.06.006
You can read some more on relating exponential distributions and Poisson processes to common discrete mathematical models of cell populations in Macklin et al. (2012):
P. Macklin, et al., Patient-calibrated agent-based modelling of ductal carcinoma in situ (DCIS): From microscopic measurements to macroscopic predictions of clinical progression. J. Theor. Biol. 301:122-40, 2012. DOI: 10.1016/j.jtbi.2012.02.002.
Lastly, I’d be delighted if you took a look at the open source software we have been developing for 3-D simulations of multicellular systems biology:
http://OpenSource.MathCancer.org
And you can always keep up-to-date by following us on Twitter: @MathCancer.
Paul Macklin featured in Biotechniques article
Paul Macklin’s work on mathematical modeling of breast cancer and BioFVM was recently featured in Kelly Rae Chi’s article in Biotechniques on virtual cell cultures. It also included great work by James Glazier (CompuCell3D) and Kristin Swanson (glioblastoma modeling).
Read the article: http://www.biotechniques.com/news/Mighty-Modelers-The-Art-of-Virtual-Cell-Culture/biotechniques-364893.html (July 20, 2016)
Return to News • Return to MathCancer • Follow @MathCancer
Paul Macklin profiled in New Scientist article
Paul Macklin was recently featured in a New Scientist article on multidisciplinary jobs in cancer. It profiled the non-linear path he and others took to reach a multi-disciplinary career blending biology, mathematics, and computing.
Read the article: http://jobs.newscientist.com/article/knocking-cancer-out/ (Apr. 16, 2015)
Paul Macklin calls for common standards in cancer modeling
At a recent NCI-organized mini-symposium on big data in cancer, Paul Macklin called for new data standards in Multicellular data in simulations, experiments, and clinical science. USC featured the talk (abstract here) and the work at news.usc.edu.
Read the article: http://news.usc.edu/59091/usc-researcher-calls-for-common-standards-in-cancer-modeling/ (Feb. 21, 2014)
Paul Macklin interviewed at 2013 PSOC Annual Meeting
Paul Macklin gave a plenary talk at the 2013 NIH Physical Sciences in Oncology Annual Meeting. After the talk, he gave an interview to the Pauline Davies at the NIH on the need for data standards and model compatibility in computational and mathematical modeling of cancer. Of particular interest:
Pauline Davies: How would you ever get this standardization? Who would be responsible for saying we want it all reported in this particular way?
Paul Macklin: That’s a good question. It’s a bit of the chicken and the egg problem. Who’s going to come and give you data in your standard if you don’t have a standard? How do you plan a standard without any data? And so it’s a bit interesting. I just think someone needs to step forward and show leadership and try to get a small working group together, and at the end of the day, perfect is the enemy of the good. I think you start small and give it a go, and you add more to your standard as you need it. So maybe version one is, let’s say, how quickly the cells divide, how often they do it, how quickly they die, and what their oxygen level is, and maybe their positions. And that can be version one of this standard and a few of us try it out and see what we can do. I think it really comes down to a starting group of people and a simple starting point, and you grow it as you need it.
Shortly after, the MultiCellDS project was born (using just this strategy above!), with the generous assistance of the Breast Cancer Research Foundation.
Read / Listen to the interview: http://physics.cancer.gov/report/2013report/PaulMacklin.aspx (2013)
Macklin Lab featured on March 2013 cover of Notices of the American Mathematical Society
I’m very excited to be featured on this month’s cover of the Notices of the American Mathematical Society. The cover shows a series of images from a multiscale simulation of a tumor growing in the brain, made with John Lowengrub while I was a Ph.D. student at UC Irvine. (See Frieboes et al. 2007, Macklin et al. 2009, and Macklin and Lowengrub 2008.) The “about the cover” write-up (Page 325) gives more detail.
The inside has a short interview on our more current work, particularly 3-D agent-based modeling. You should also read Rick Durrett‘s perspective piece on cancer modeling (Page 304)—it’s a great read! (And yup, Figure 3 is from our patient-calibrated breast cancer modeling in Macklin et al. 2012. ;-) )
The entire March 2013 issue can be accessed for free at the AMS Notices website:
http://www.ams.org/notices/201303/
I want to thank Bill Casselman and Rick Durrett for making this possible. I had a lot of fun in the process, and I’m grateful for the opportunity to trade ideas!